Muhammad Hasham Hussain
Data Science & Machine Learning
M.S. student building projects across machine learning, statistical analysis, and data visualization.
About
Hi, I'm Hasham, welcome to my portfolio. I'm currently pursuing an M.S. in Data Science & Analytics, working on projects across machine learning, statistical analysis, and data visualization. I'm looking for internships (fall, spring, and summer) as well as full-time / new-grad roles starting in 2027, feel free to reach out.
Projects
shadenav — Shade-Aware Pedestrian Routing
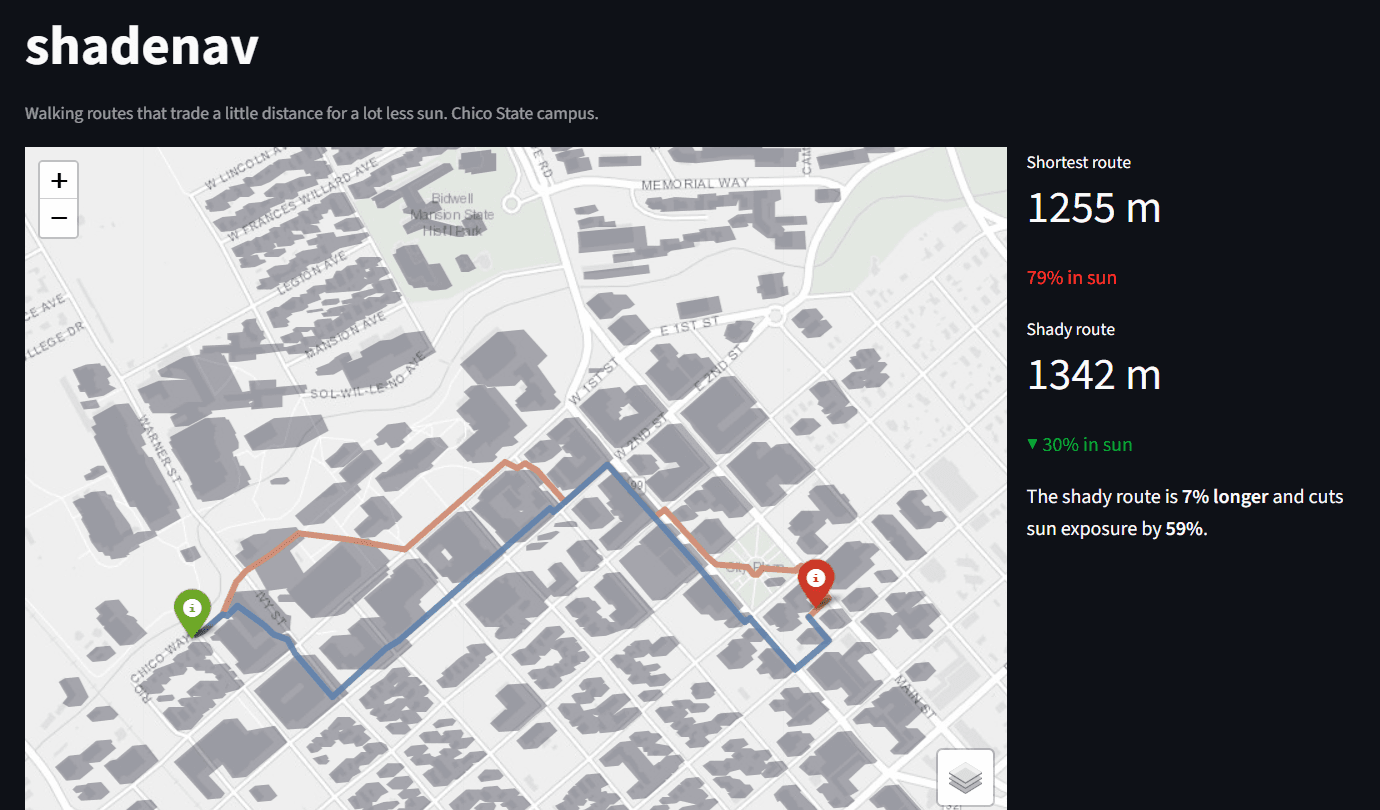
A routing tool that models where building shadows fall at any date and time, scores every street segment by sun exposure, and finds walking routes that trade a little extra distance for a lot less time in direct sun. Built on an end-to-end geospatial pipeline over the Chico State campus: OpenStreetMap street networks and building footprints, sun-position modeling, shadow-casting geometry, and shade-weighted shortest-path routing. Validated across 200 routes — a mild shade preference cuts sun exposure by roughly 20% for about 2% extra distance.
- Python
- pvlib
- NetworkX
- OpenStreetMap
- Geospatial
Keyword vs. Meaning Search
A full-stack search engine comparing BM25 (keyword-based ranking) against neural embeddings (semantic ranking) over 500+ real Spotify tracks. Includes live Spotify search integrated as a retrieve-then-rerank layer, with automatic fallback to a precomputed local corpus if the live call fails or times out.
- Python
- FastAPI
- onnxruntime
- rank_bm25
- Spotify Web API
- JavaScript
Does Song Energy Predict Popularity?
Analyzed 25,736 Spotify tracks across six genres to test whether a song's energy predicts its popularity. Used Pearson correlation and linear regression with an energy × genre interaction term. Found a statistically significant but very weak negative relationship — energy explains under 1% of the variance in popularity, and it does not meaningfully change across genres.
- R
- tidyverse
- ggplot2
- Linear Regression
- Tableau
Skills
Languages
- Python
- SQL
- R
ML / Data Science
- scikit-learn
- PyTorch
- pandas
Visualization
- Matplotlib
- Tableau
- Plotly